Can you figure out how we knew which boxes on the chart to shade in?
Here's what we did:
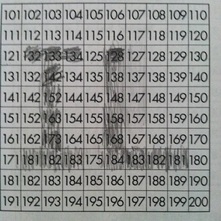
As our math students examined a portion of a 300 chart today, they were looking for numbers that were placed incorrectly. Each square that contained a number that didn't fit in the sequence was to be shaded in.
There were questions kids asked when they found a number that didn't fit, such as, "If this number doesn't fit, should the next one be the one that was skipped in the previous box?" Students needed to see the structure of the chart to know which numbers were in the proper places regardless of the ones that were shaded (since they were "wrong"). Looking at the ones' place and noticing the way the same digits were found there in each column was one strategy. The tens' place was sometimes needed to help when the proper digit was in the ones place, but the number still didn't belong. Looking across the rows, there was a new digit appearing in the tens' place at a certain location. How could this "odd" occurrence be explained in the sturcture of this particular chart? Is there another chart structure that could be used where there isn't an exception to deal with in each row?
Finally, there will be some who know that "IL" is no longer the state with the tallest building in the US. I became curious about what year was the last one when a tower in the state hinted at above was the tallest in the US? When and why did that structure have its name changed? How soon will it be before our own tallest building in Boston undergoes a similar and-change fate? For information from Wikipedia about today's tallest US skyscrapers, you can follow the link below. Feel free to comment, also, as this is the first post to this new blog!
Here's what we did:
As our math students examined a portion of a 300 chart today, they were looking for numbers that were placed incorrectly. Each square that contained a number that didn't fit in the sequence was to be shaded in.
There were questions kids asked when they found a number that didn't fit, such as, "If this number doesn't fit, should the next one be the one that was skipped in the previous box?" Students needed to see the structure of the chart to know which numbers were in the proper places regardless of the ones that were shaded (since they were "wrong"). Looking at the ones' place and noticing the way the same digits were found there in each column was one strategy. The tens' place was sometimes needed to help when the proper digit was in the ones place, but the number still didn't belong. Looking across the rows, there was a new digit appearing in the tens' place at a certain location. How could this "odd" occurrence be explained in the sturcture of this particular chart? Is there another chart structure that could be used where there isn't an exception to deal with in each row?
Finally, there will be some who know that "IL" is no longer the state with the tallest building in the US. I became curious about what year was the last one when a tower in the state hinted at above was the tallest in the US? When and why did that structure have its name changed? How soon will it be before our own tallest building in Boston undergoes a similar and-change fate? For information from Wikipedia about today's tallest US skyscrapers, you can follow the link below. Feel free to comment, also, as this is the first post to this new blog!
